

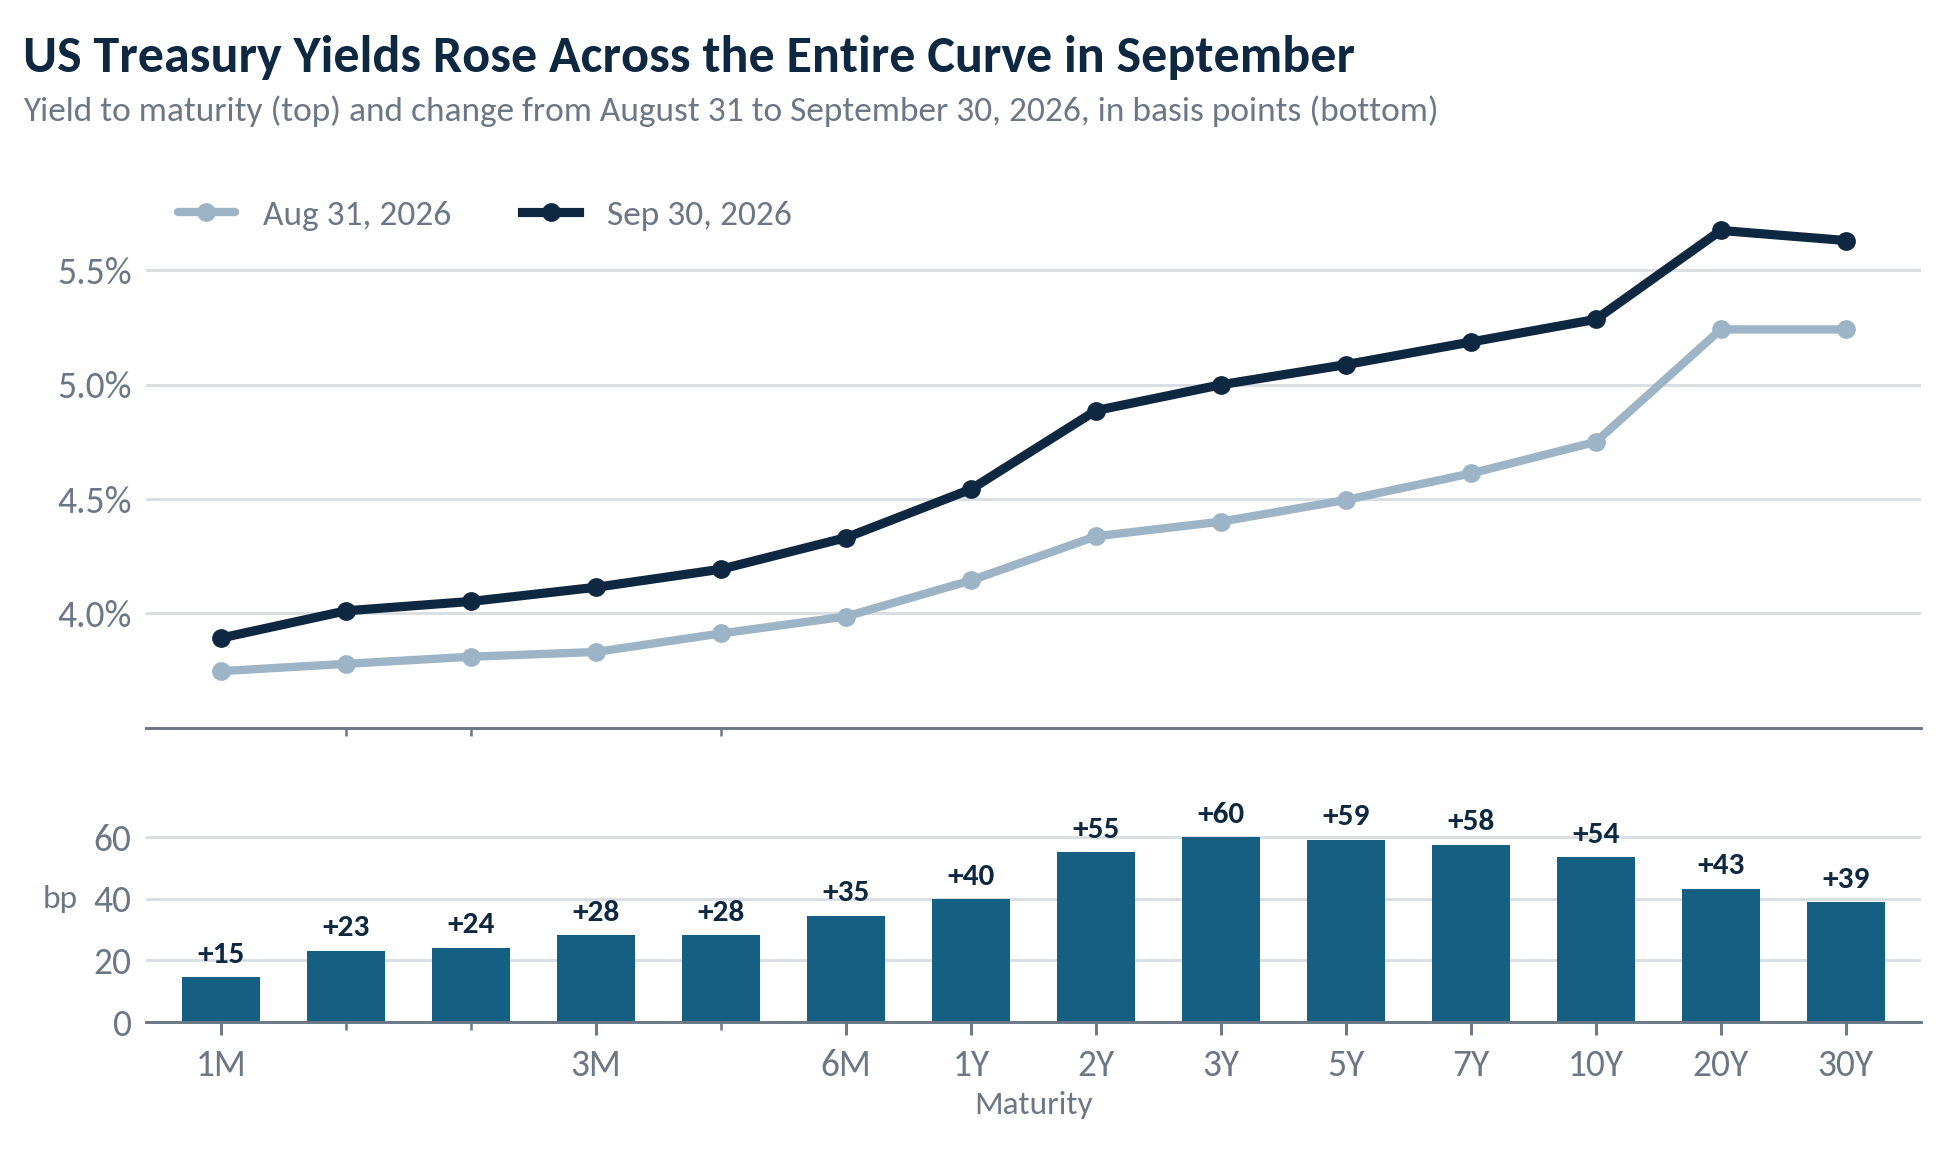
Fall has arrived, and Halloween is quickly approaching. September brought an early scare to bond investors as interest rates spiked, pushing down the value of existing bond holdings. Yields at every maturity on the US Treasury curve moved sharply higher:
Source: Bloomberg
This historic move was the result of one major driver combined with several ancillary factors:
War in Iran pushed oil prices higher. Energy is an input to nearly every part of the economy, and a supply shock of this kind raises inflation expectations. Bond investors respond by demanding higher yields to compensate for the risk that inflation erodes the value of their fixed payments. The effect has been visible in interest rates globally, not just in the US.
Heavy new bond supply met weak demand. Bond issuance has been substantial, and investors are weighing it against other uses of capital, including corporate borrowing to fund the build-out of data centers. With more borrowers competing for a finite pool of capital, buyers can demand higher yields to absorb the new supply.
The economy continues to grow, and the labor market is in balance. Hiring and firing are both subdued, a “low hire, low fire” environment, which points to stability rather than weakness. Steady growth gives investors little reason to expect near-term rate cuts and reduces the appeal of Treasuries as a safe haven, adding to upward pressure on yields.
The term premium is rising on lingering fiscal concerns. The term premium is the extra yield investors require to hold longer-maturity bonds rather than rolling over short-term ones. Persistent concerns about federal deficits and the growing supply of government debt have led investors to ask for more compensation for lending to the government over longer horizons.
The Federal Reserve has pivoted to a rate-hiking cycle. A shift toward tighter policy pushes up yields at the short end of the curve and forces markets to reprice the expected path of interest rates. As the chart above shows, yields rose across the entire curve, not just in longer maturities.
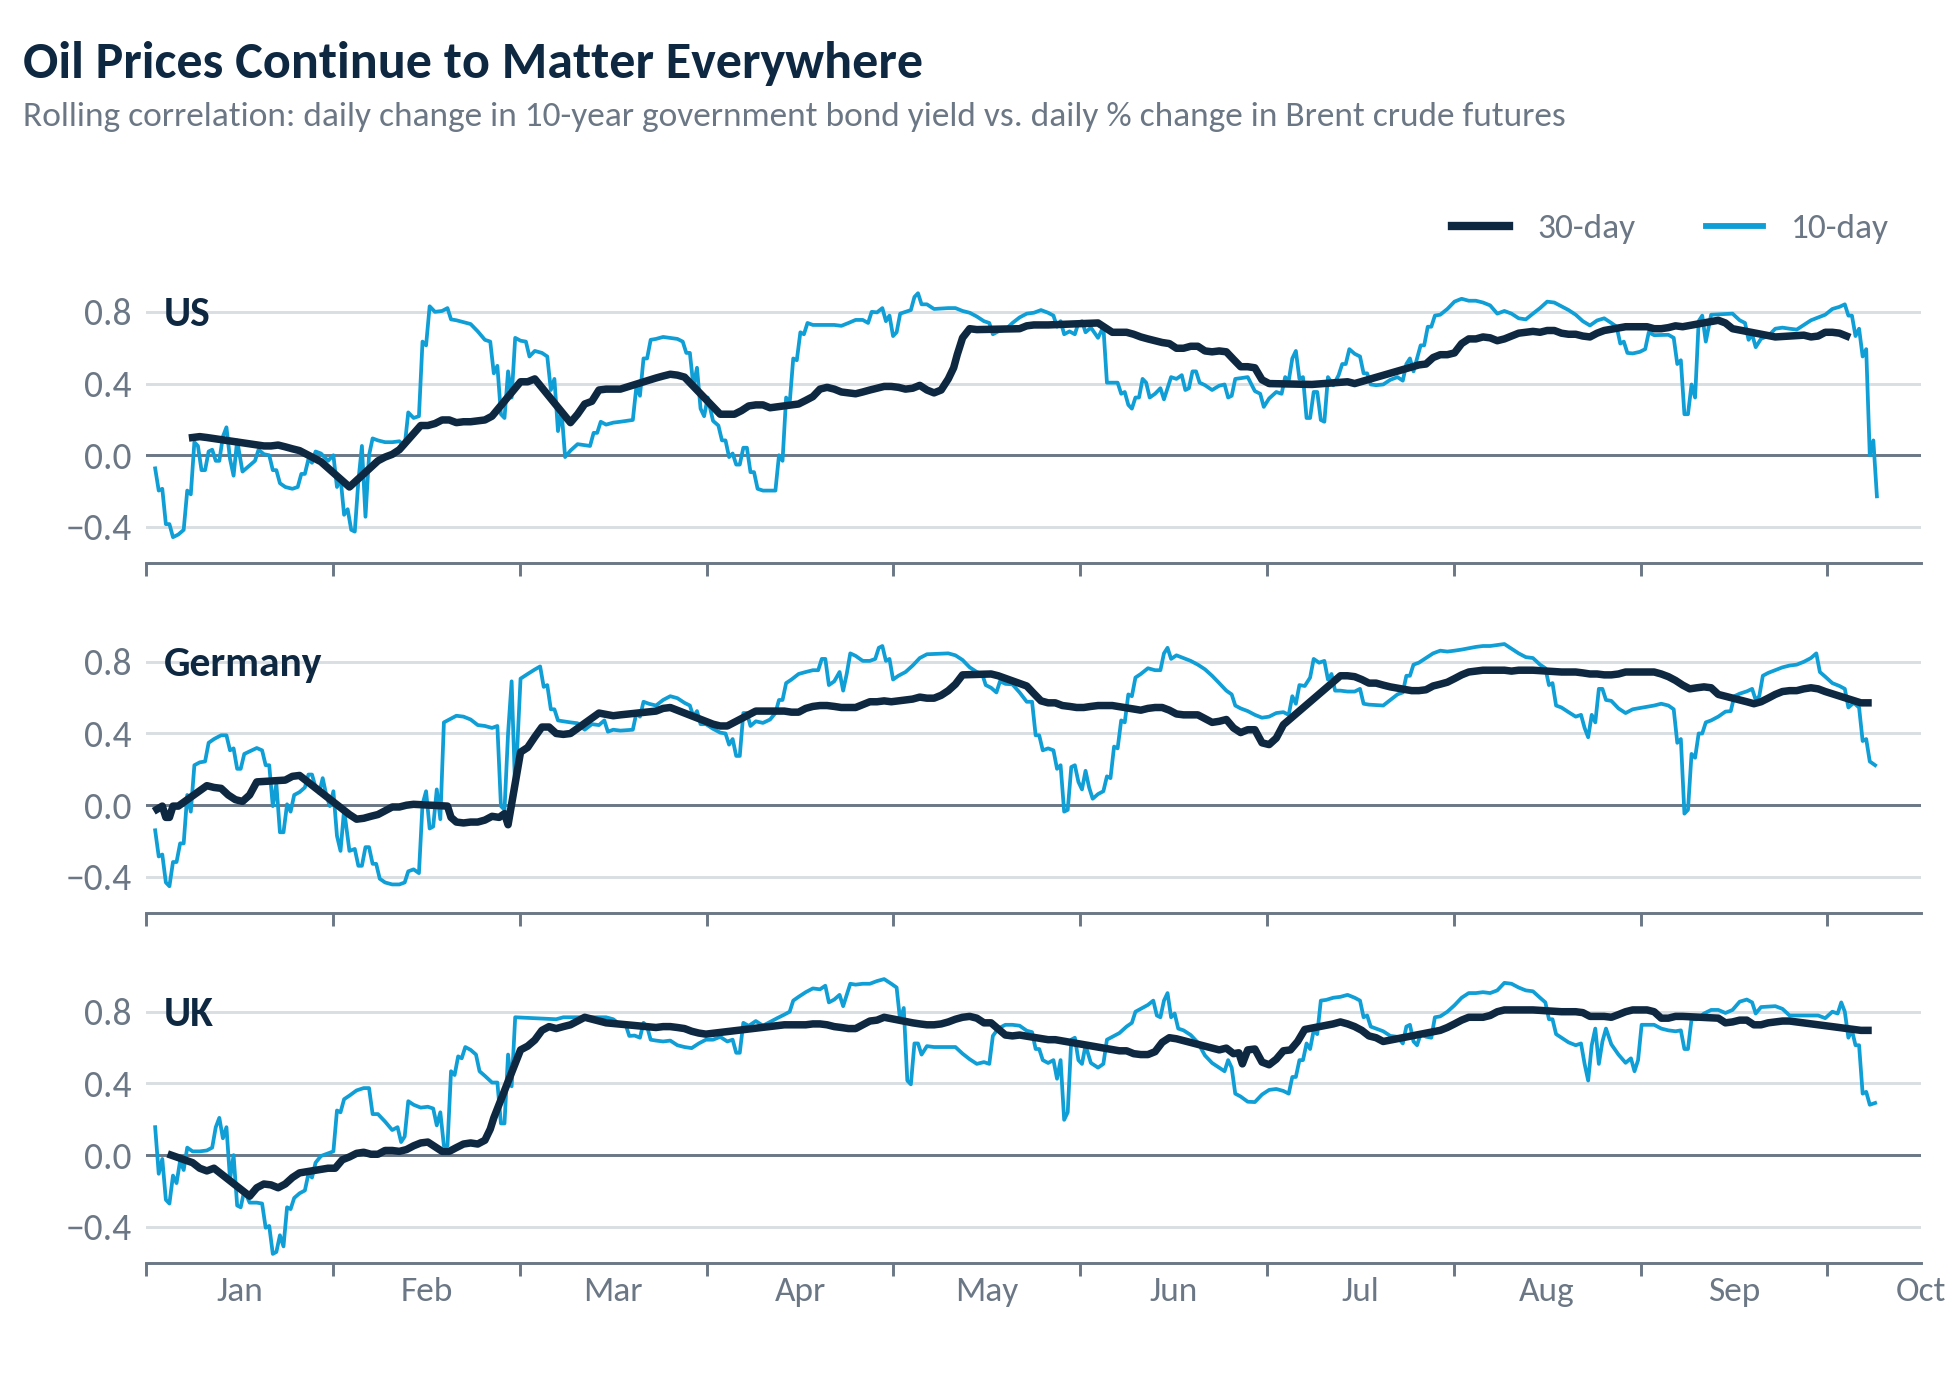
There’s an old adage: don’t fight the Fed. In this instance, however, it is fair to question how effective a Fed hiking cycle will be against rising rates that are largely being driven higher by an energy supply shock. The selloff in government bonds remains tied to oil prices, as the correlation is clear in the US and abroad:
Source: BCA Research, “Global Model Bond Portfolio Q4/26: A Mild Hiking Cycle Offers A Buyable Dip.” Underlying data: CME Group.
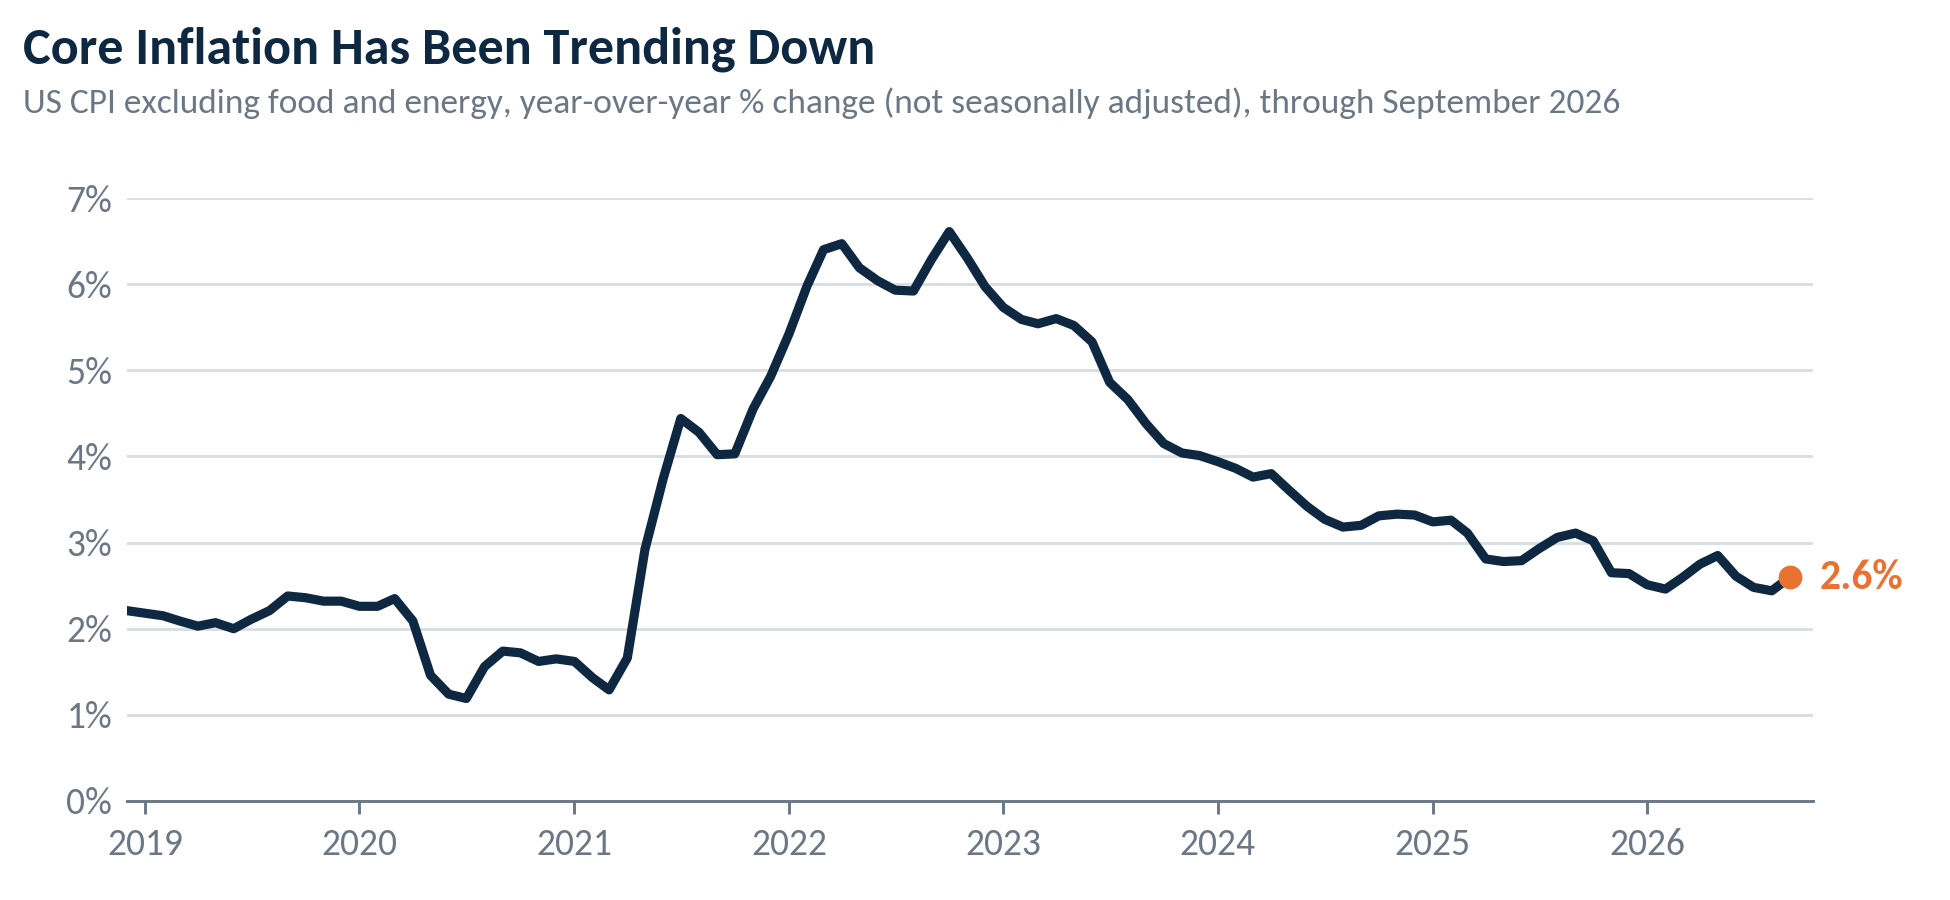
We understand how the Federal Reserve could be spooked by the risk of inflation reaccelerating following its inaction coming out of the pandemic. Unfortunately, the Federal Reserve’s blunt tool of raising interest rates to tighten financial conditions will do little to end the war in Iran or reduce energy prices. Excluding food and energy, inflation has been trending down toward the Fed’s 2% target. The risk lies in the secondary effects of increased energy costs flowing through to the prices of core goods and services, which may be reflected in September’s inflation data.
Source: Bloomberg
A series of rate hikes by the Federal Reserve risks slowing the US economy unnecessarily. We therefore believe this hiking cycle will be short-lived, reversing the insurance cuts made in 2025 and ending there.
Trick or Treat in Muni Markets?
Tax-exempt municipal bonds suffered an even greater drawdown, as retail investors tend to be the most skittish in times of bond market distress, selling first and asking questions later. September was the worst single month for municipal performance since the Global Financial Crisis, but the damage was due entirely to higher rates rather than credit deterioration. In fact, municipal credit spreads tightened rather than widened, which points to still-solid fundamentals.
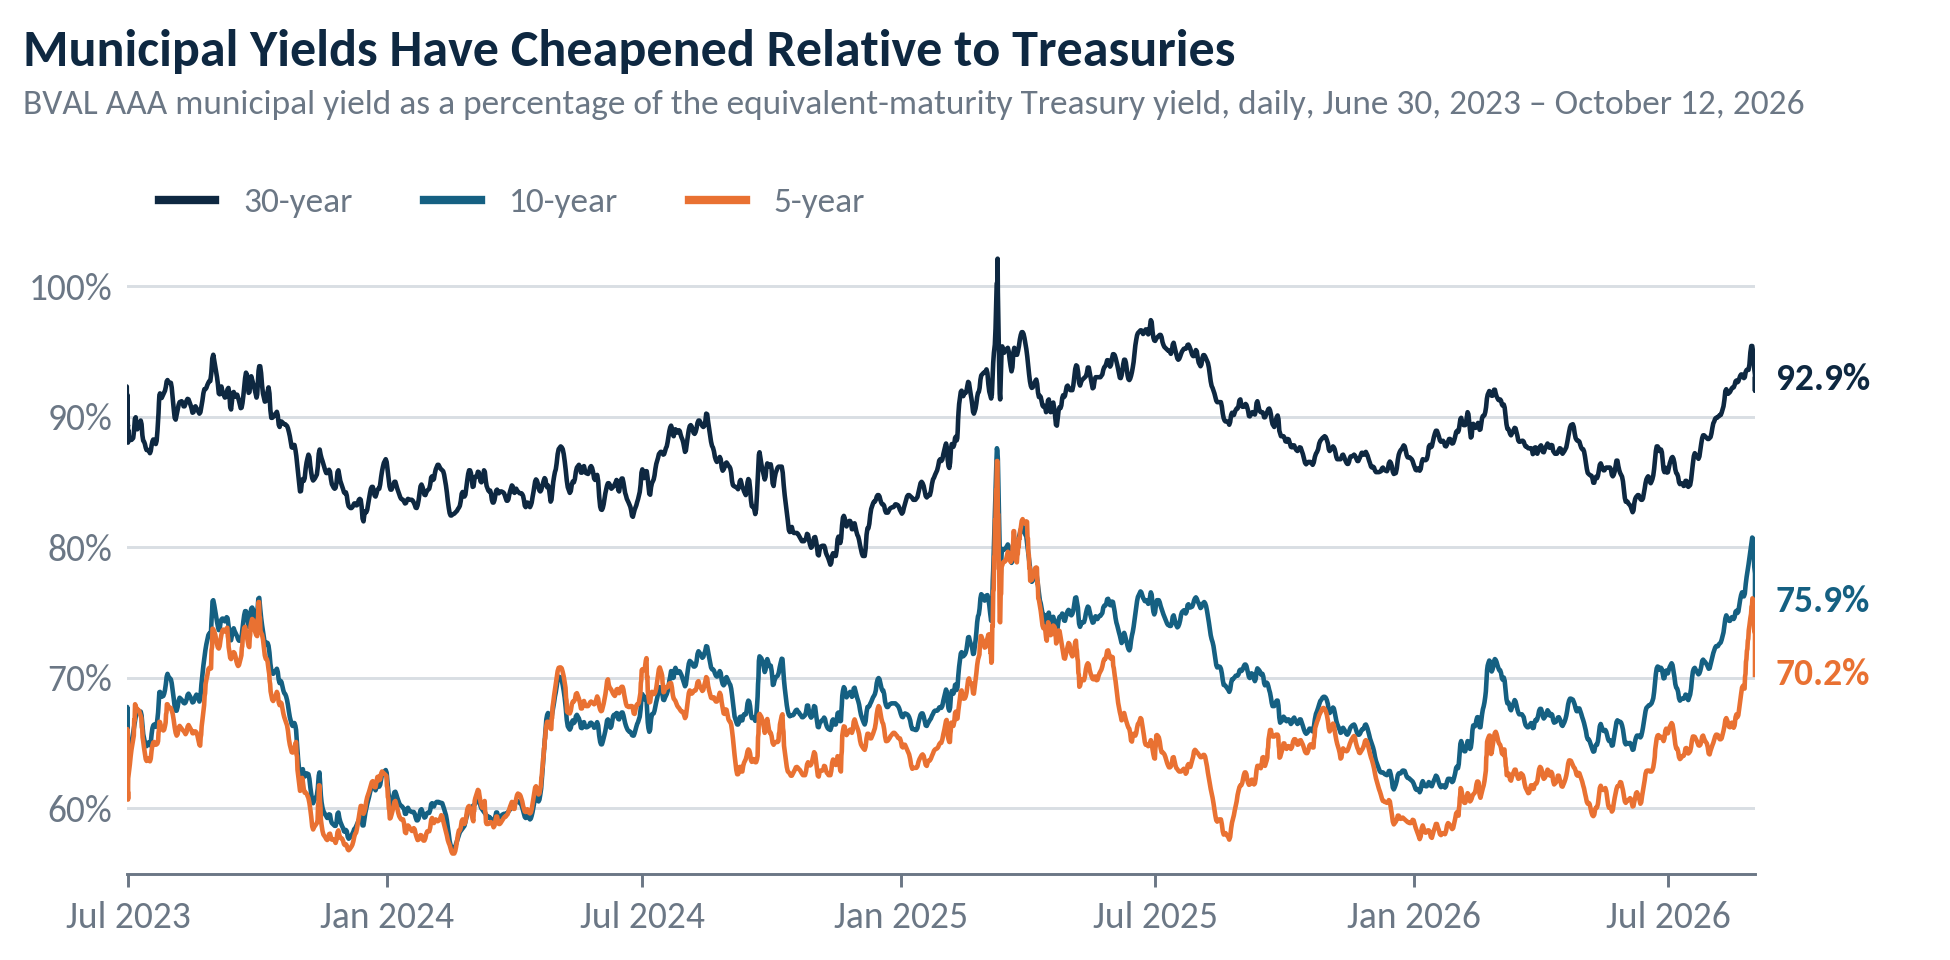
The BVAL AAA municipal yield, as a percentage of equivalent Treasury yields, rose to levels not seen since early 2025, when there was an unfounded fear that municipal bonds’ tax-exempt status would be eliminated. As a result, investors in the highest tax brackets can currently lock in tax-equivalent yields in the 7–10% range across the municipal yield curve.
Source: Bloomberg
Historically, drawdowns of this magnitude have created attractive entry points. In fact, following every prior municipal drawdown since 2010, performance rebounded over the subsequent one-, three- and five-year periods.
Municipal Bond Drawdowns and Annualized Forward Returns
Drawdown and annualized return over the 1, 3 and 5 years following each episode’s trough, by index.
| Episode (Period) | 1–10 Yr Blend: Drawdown | +1Y | +3Y | +5Y | High Grade: Drawdown | +1Y | +3Y | +5Y | High Yield: Drawdown | +1Y | +3Y | +5Y |
|---|---|---|---|---|---|---|---|---|---|---|---|---|
| Meredith Whitney (Sep 2010 to Jan 2011) | −2.2% | +9.1% | +4.1% | +3.8% | −6.4% | +14.9% | +6.0% | +6.0% | −6.8% | +15.0% | +8.3% | +7.8% |
| Taper Tantrum (May to Aug 2013) | −2.6% | +5.6% | +3.9% | +2.5% | −6.4% | +9.8% | +6.5% | +4.1% | −11.6% | +14.7% | +9.1% | +7.1% |
| Trump Election (Sep to Nov 2016) | −3.0% | +3.6% | +3.7% | +3.2% | −5.1% | +5.6% | +5.0% | +4.4% | −7.2% | +9.8% | +8.7% | +7.8% |
| COVID-19 (Mar to Apr 2020) | −7.9% | +10.8% | +2.6% | +2.6% | −10.9% | +13.3% | +2.6% | +2.7% | −19.0% | +25.8% | +6.0% | +6.4% |
| Fed Rate Hike Cycle (Jan to Oct 2022) | −7.0% | +2.3% | +4.5% | N/A | −13.4% | +2.7% | +5.5% | N/A | −18.1% | +4.4% | +8.1% | N/A |
| 2023 Rate Resurgence (Aug to Oct 2023) | −2.2% | +6.4% | +2.6%* | N/A | −11.0% | +9.7% | +3.1%* | N/A | −14.6% | +17.5% | +5.8%* | N/A |
| 2025 Tariff Shock (Apr 2025) | −2.0% | +7.6% | N/A | N/A | −6.0% | +9.6% | N/A | N/A | −6.1% | +8.5% | N/A | N/A |
| Current Drawdown (Sep 2026 to present) | −4.7% | N/A | N/A | N/A | −6.7% | N/A | N/A | N/A | −5.9% | N/A | N/A | N/A |
| Average (all episodes) | −4.0% | +6.5% | +3.6% | +3.0% | −8.2% | +9.4% | +4.8% | +4.3% | −11.2% | +13.7% | +7.7% | +7.3% |
| Positive return rate (completed episodes) | N/A | 100.0% | 100.0% | 100.0% | N/A | 100.0% | 100.0% | 100.0% | N/A | 100.0% | 100.0% | 100.0% |
Source: Goldman Sachs, “Macro Shock, Muni Opportunity,” October 2026. Underlying data: Bloomberg as of 9/30/2026. All forward returns are annualized (CAGR) from each episode’s trough date. N/A = forward period not yet elapsed, or not applicable. *Partial period; annualized through September 29, 2026. Averages are simple means across episodes with available data. Indices: Bloomberg LMBITR (High Grade), B12MTR (Municipal 1–10 Yr Blend), LMHYTR (High Yield).
Whether this proves to be a Halloween trick or treat for bond investors depends largely on time horizon. Some may have felt tricked by the short-term paper losses on their September statements. Through a longer lens, however, it may prove to be a treat, as higher starting yields offer greater income potential going forward.
Thank you, as always, for your continued confidence and trust.
Manhattan West Asset Management, LLC (“MWAM”) is an SEC registered investment adviser located in California. MWAM may only transact business in those states in which it is notice filed or qualifies for an exemption or exclusion from notice filing requirements. This summary should not be construed by any consumer and/or prospective client as MWAM’s rendering of personalized investment advice. Any subsequent, direct communication by MWAM with a prospective client shall be conducted by a representative that is either registered or qualifies for an exemption or exclusion from registration in the state where the prospective client resides. For information pertaining to the registration status of MWAM, please contact the United States Securities and Exchange Commission on their web site at www.adviserinfo.sec.gov. A copy of MWAM’s current written disclosure brochure discussing MWAM’s business operations, services, and fees is available upon written request.